Dashboards and Research
Our research initiatives are at the forefront of innovation and contribute to the advancement of knowledge in various fields. Explore our research page to learn more about our students, initiatives, and resources that drive discovery and decisions. The South Dakota Board of Regents believes in the transformative value in research and strives to create a system based on data, critical thinking, and creativity.

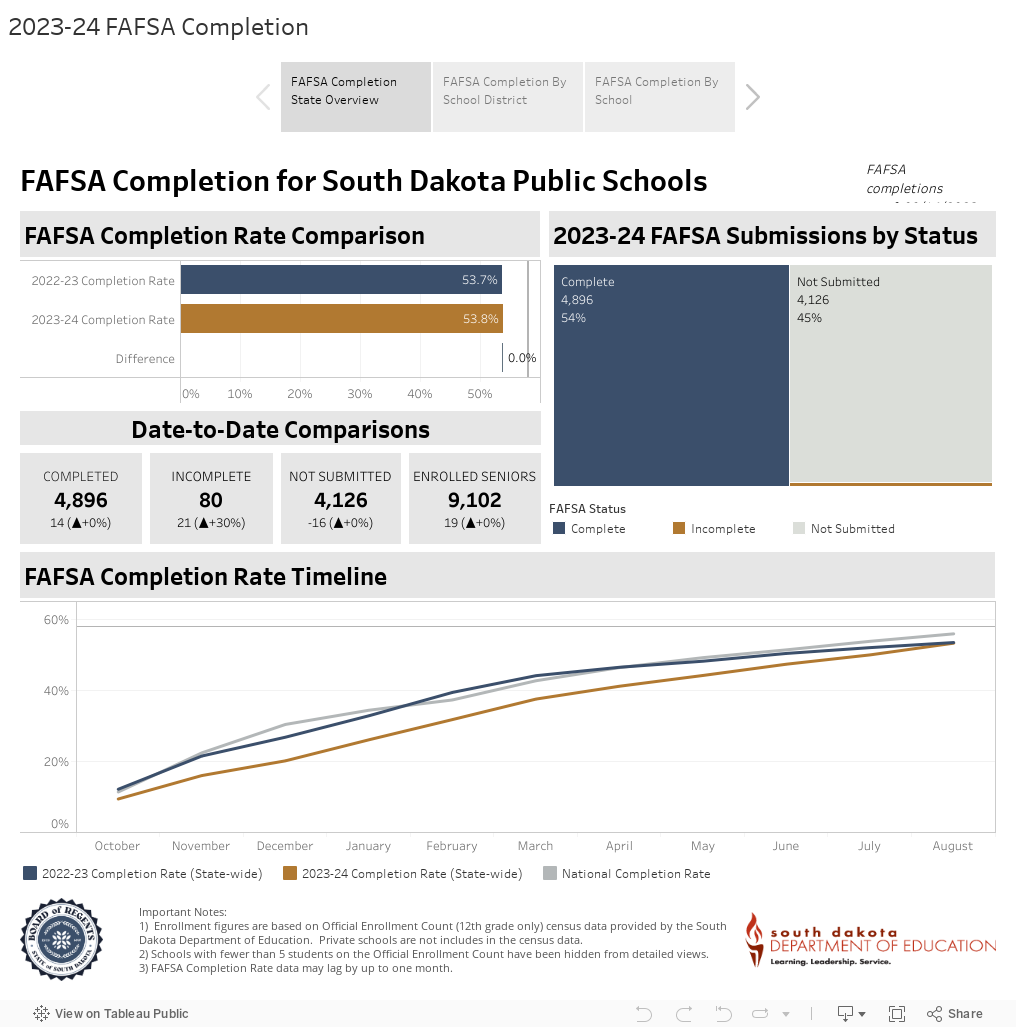
FAFSA Completion
The FAFSA is the Free Application for Federal Student Aid. It determines a student’s eligibility for federal financial aid (federal grants and student loans), and it helps other organizations, such as state governments and private foundations, to determine your eligibility for their financial aid programs.
Research shows that students who complete the FAFSA are much more likely to apply and attend a post-secondary institution. The South Dakota Board of Regents works with South Dakota school districts to help encourage and track the number of students applying for federal aid.
Check back soon for additional dashboards!

Publications
Discover valuable information through comprehensive research and reporting provided by the South Dakota Board of Regents. Gain valuable insights from a wide range of studies, including detailed economic impact assessments, initiatives that cover the entire system, and year-over-year comparisons that provide insight into the region’s progress over time.
